
After what has seemed like a straight vertical rise, we have seen a recent break in the march of yields upward. It will be interesting to see if this is the transition point to falling rates or just a pause as the market prices in more rate hikes.

The 2-year yield of U.S. Treasury Notes is shown in the chart above. The speed of a yield increase generally has more impact than the absolute value of a increase. And it is the speed of the most recent increase that is making this current fixed income environment feel so horrible. Normally when yields rise, they do not do so in such a steep, vertical fashion. This rapid ascent has left little room for fixed income investors to reinvest at the higher yields which usually cushions a rise in interest rates.
Looking at the two examples of rising interest rates highlighted with orange arrows in the chart above, between 8/9/2011 and 10/19/2018, the US 2-Year yield went from 0.13% to 2.91% increasing 2.79%, while SHY – the iShares 1-3 Year Treasury Bond ETF – with a similar duration produced a +2.72% total return over that time frame. However, between 2/5/2021 and 5/3/2022, the US 2-Year yield went from 0.09% to 2.75% for a 2.66% rise, while SHY returned -3.77% over that time frame. What explains the difference in total return in the tracking ETF between the two periods when the total change in government yields is very similar? The answer is simple since bonds are just math. When yields increase over a long period of time, new bond issues come out at higher yields and are entered into the index. Also, current bond coupons are reinvested at a higher yield. These two things can turn a interest rate increase from a highly negative to a positive result, when done over a sufficient time frame.
It is the speed, not just the absolute level of yield changes, that matter to bond returns. With the pause in rising rates, it gives the markets time to digest the changes and the rapid rise that has already happened. Now new bond issues and coupons will be invested at the higher yields. This will be beneficial to fixed income returns going forward.
Past performance is no guarantee of future results. Trend signals are proprietary research of EWM Investment Solutions, a wholly owned subsidiary of Executive Wealth Management, LLC. Data source for returns is FactSet Research Systems Inc. This chart is not intended to provide investment advice and should not be considered as a recommendation. One cannot invest directly in an index. Executive Wealth Management does not guarantee the accuracy of this data.
Model Updates
There were no trades in the EWM Investment Solutions models during the week ending on May 28th, 2022. Large-cap domestic equity still maintains its long-term favorable trend, and U.S. stocks remain over-weighted versus international shares in EWM’s Asset Allocation models.
Quote of the Week
Stocks have never divided perfectly into growth and value buckets, because most companies are meant to grow, and value is subjective. Rule of thumb: If you’re embarrassed to name the company but are proud of the price you paid, it might be a value stock. The opposite goes for growth
Barron’s columnist Jack Hough giving novice investors his criteria for differentiating between growth and value stocks in the latest issue of the magazine.
Executive Wealth Management (EWM) is a Registered Investment Advisor with the Securities and Exchange Commission. Reference to registration does not imply any particular level of qualification or skill. Investment Advisor Representatives of Executive Wealth Management, LLC offer Investment Advice and Financial Planning Services to customers located within the United States. Brokerage products and services offered through Private Client Services Member FINRA/SIPC. Private Client Services and Executive Wealth Management are unaffiliated entities. EWM does not offer tax or legal advice. Please do not transmit orders or instructions regarding your accounts by email. For your protection, EWM does not accept nor act on such instructions. Please speak directly with your representative if you need to give instructions related to your account. If there have been any changes to your personal or financial situation, please contact your Private Wealth Advisor.
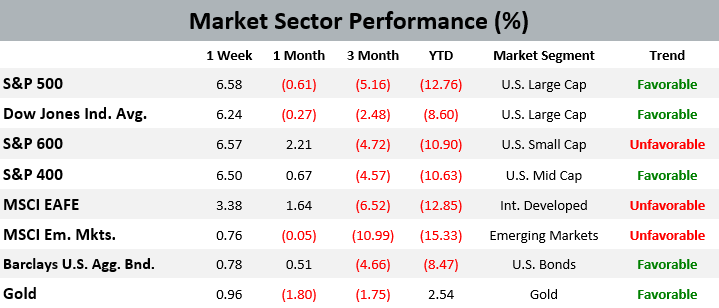
Returns are calculated as indicated below with reinvested dividends not considered except for the Barclays U.S. Aggregate Bond Index. Data source for returns is FactSet Research Systems Inc. The London Gold PM Fix Price is used to calculate returns for gold.
1 Week = closing price on May 20, 2022 to closing price on May 27, 2022
1 Month = closing price on April 27, 2022 to closing price on May 27, 2022
3 Month = closing price on February 25, 2022 to closing price on May 27, 2022
YTD = closing price on December 31, 2021 to closing price on May 27, 2022
All information and opinions expressed in this document were obtained from sources believed to be reliable and in good faith, but no representation or warranty, express or implied, is made as to its accuracy or completeness. All information and opinions as well as any prices indicated are current only as of the date of this report, and are subject to change without notice. Material provided is for information purposes only and should not be used or construed as an offer to sell, or solicitation of an offer to buy nor recommend any security. Any commentaries, articles of other opinions herein are intended to be general in nature and for current interest. Some of the material may be supplied by companies not affiliated with EWM and is not guaranteed for accuracy, timeliness, completeness or usefulness and EWM is not liable or responsible for any content advertising products or services.
Copyright © 2022 Executive Wealth Management. All rights reserved.