
There was a “good” jobs report released by the US Bureau of Labor Statistics (US BLS) on Friday of last week. For July, the US added 943,000 to employer payrolls. This beat the consensus estimate by 68,000, or to put it another way, it was ahead of forecasts by 7.8%. That is a big beat for any economic data point, and the market’s reaction was… mixed with the S&P 500 up +0.18% and the Nasdaq 100 down -0.48%. We have had such a long period of bad news being good for the market and good news being good for the market, it was novel to see the market’s indifference to good news.
Backing up, we wanted to take a look at the longer term employment picture. This is still difficult to parse when you see big numbers being thrown around, so as usual a chart will help the visual learners (99% of us) understand what is really happening.
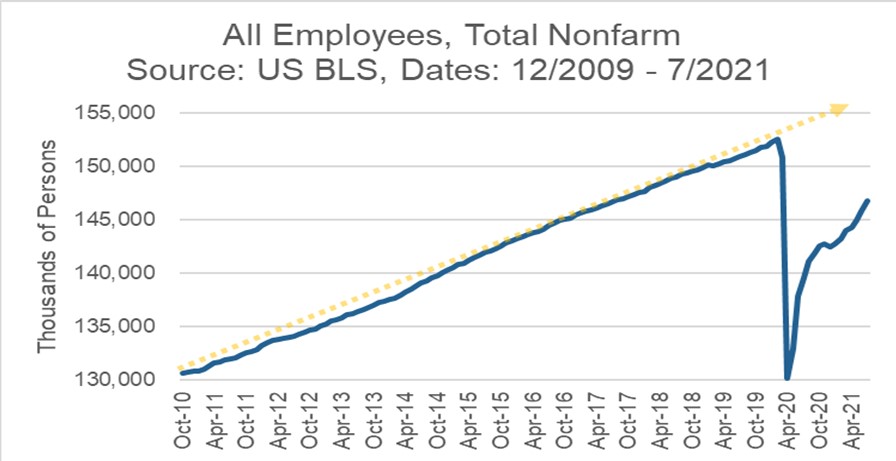
The US is back to the number of employed that we had in mid-2017. We are still -3.7% off of the all-time high for employees. That translates to roughly 5.7 million less employed than prior to the pandemic. We are not here to rain on any recovery parades, but it does bear pointing out.
What we want to focus on is when or if we can ever get back to the previous trend growth. We discussed potential GDP growth a couple of weeks ago, and one of the biggest drivers of potential GDP is the size and growth of the labor force. We see in the chart below that what we are really missing is the trend rate of growth. If we would have kept growing as before, where would we be now? Each successive crisis in the recent past has altered the trend rate of growth in the labor force.
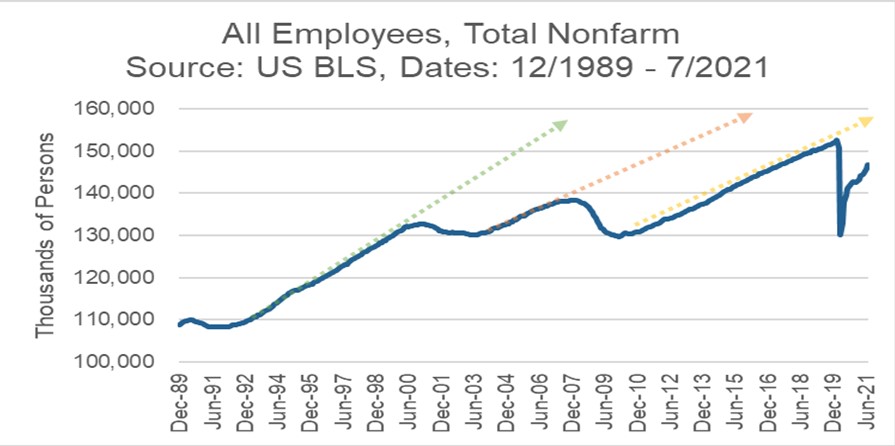
There are obviously some demographic issues that are happening here, but it is key that we did not get back to the trend line after the tech bubble burst of 2000 and the global financial crisis of 2007 to 2009. We are now moving back quicker than before, as would be expected with such a quick reopening, but will there be an inflection point to a slower growth rate? If that happens, then we will see adjustments to the ability of the economy to grow long term.
We are looking forward to the September and October jobs reports to see just how quickly people get back to work after the enhanced unemployment benefits fully roll off the books. We have seen employment rise in areas of the country that ended the enhanced benefits early. But we may never get back to that prior trend growth rate. There has been a large decrease in the employment rate of workers aged 55 and over that was not happening prior to COVID. Many Boomers were working well past the retirement age of 65, but that trend has reversed itself recently. It remains to be seen if they will exit the workforce altogether and if the younger birth cohorts will have enough participation in the labor market to get us back to where we were headed in the first place.
Quote of the Week
| So I encourage you to look at the trends and not misunderstand and over-focus on the wiggles. Excerpt from an article published by hedge fund manager Ray Dalio on recent happenings in the Chinese equity markets. By “the wiggles”, we presume Mr. Dalio means short-term fluctuations in share prices and not the Australian children’s musical group. |
Past performance is no guarantee of future results. Trend signals are proprietary research of Fortunatus Investments, LLC, a Registered Investment Advisor with the Securities and Exchange Commission (SEC). Reference to registration does not imply any particular level of qualification or skill. Prior to June 2014, Fortunatus Investments was a wholly owned subsidiary of Executive Wealth Management, LLC and they continue to share common ownership and control. Data source for returns is FactSet Research Systems Inc. This chart is not intended to provide investment advice and should not be considered as a recommendation. One cannot invest directly in an index. Executive Wealth Management does not guarantee the accuracy of this data.
Model Update
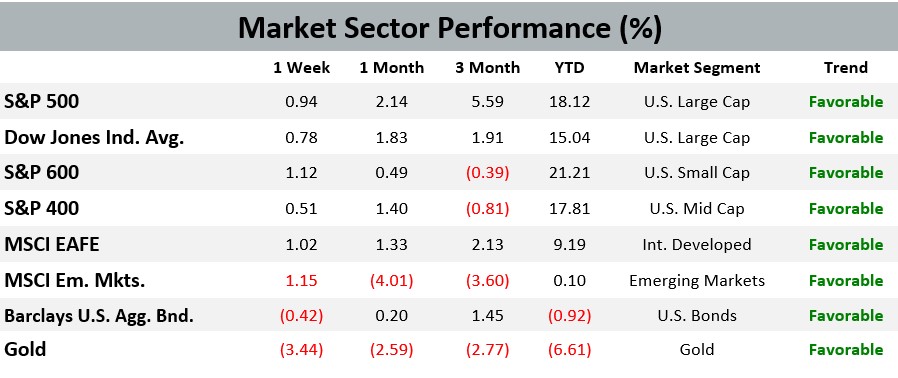
There were no trades in the Fortunatus models during the week ending on July 31st, 2021. The major equity market sectors remain in a long-term favorable trend, and the Fortunatus Asset Allocation models are near their maximum allowable equity exposure with domestic stocks favored over international shares.
On a Lighter Note
Recently, this writer ran into a scientist at the science market peddling science things. He was selling protons and electrons for $10 each but was just handing out neutrons to anyone passing by. When I asked him why he wasn’t accepting any money for the neutrons, he replied, “They’re free of charge.” True story.
So you can see that neutrons, the Switzerland of the subatomic world, have been undervalued in society. It’s a particle that people just don’t have positive or negative feelings about. But as we approach the 90th anniversary of its discovery by British physicist James Chadwick, we should take a moment to acknowledge its worth. While protons have their pH and electrons have their valency, neutrons provide unmeasured value as the ballast that stabilizes the universe. Also, neutrons generate isotopes, and it is isotopes that bring about carbon dating. Thus, without the helpful nudging of neutrons, all the organic atoms would be sitting at home alone every Friday night. How exactly do neutrons encourage this carbon courtship? By throwing the best particle parties featuring upbeat 80s dance jams designed to get the atoms vibrating:
The Pointer Sisters – “Neutron Dance”
Executive Wealth Management (EWM) is a Registered Investment Advisor with the Securities and Exchange Commission. Reference to registration does not imply any particular level of qualification or skill. Investment Advisor Representatives of Executive Wealth Management, LLC offer Investment Advice and Financial Planning Services to customers located within the United States. Brokerage products and services offered through Private Client Services Member FINRA/SIPC. Private Client Services and Executive Wealth Management are unaffiliated entities. EWM does not offer tax or legal advice. Please do not transmit orders or instructions regarding your accounts by email. For your protection, EWM does not accept nor act on such instructions. Please speak directly with your representative if you need to give instructions related to your account. If there have been any changes to your personal or financial situation, please contact your Private Wealth Advisor.
Returns are calculated as indicated below with reinvested dividends not considered except for the Barclays U.S. Aggregate Bond Index. Data source for returns is FactSet Research Systems Inc. The London Gold PM Fix Price is used to calculate returns for gold.
1 Week = closing price on July 30, 2021 to closing price on August 6, 2021
1 Month = closing price on July 6, 2021 to closing price on August 6, 2021
3 Month = closing price on May 6, 2021 to closing price on August 6, 2021
YTD = closing price on December 31, 2020 to closing price on August 6, 2021
All information and opinions expressed in this document were obtained from sources believed to be reliable and in good faith, but no representation or warranty, express or implied, is made as to its accuracy or completeness. All information and opinions as well as any prices indicated are current only as of the date of this report, and are subject to change without notice. Material provided is for information purposes only and should not be used or construed as an offer to sell, or solicitation of an offer to buy nor recommend any security. Any commentaries, articles of other opinions herein are intended to be general in nature and for current interest. Some of the material may be supplied by companies not affiliated with EWM and is not guaranteed for accuracy, timeliness, completeness or usefulness and EWM is not liable or responsible for any content advertising products or services.
Copyright © 2021 Executive Wealth Management. All rights reserved.