
Past performance is no guarantee of future results. Trend signals are proprietary research of Fortunatus Investments, LLC, a Registered Investment Advisor with the Securities and Exchange Commission (SEC). Reference to registration does not imply any particular level of qualification or skill. Prior to June 2014, Fortunatus Investments was a wholly owned subsidiary of Executive Wealth Management, LLC and they continue to share common ownership and control. Data source for returns is FactSet Research Systems Inc. This chart is not intended to provide investment advice and should not be considered as a recommendation. One cannot invest directly in an index. Executive Wealth Management does not guarantee the accuracy of this data.
Market News
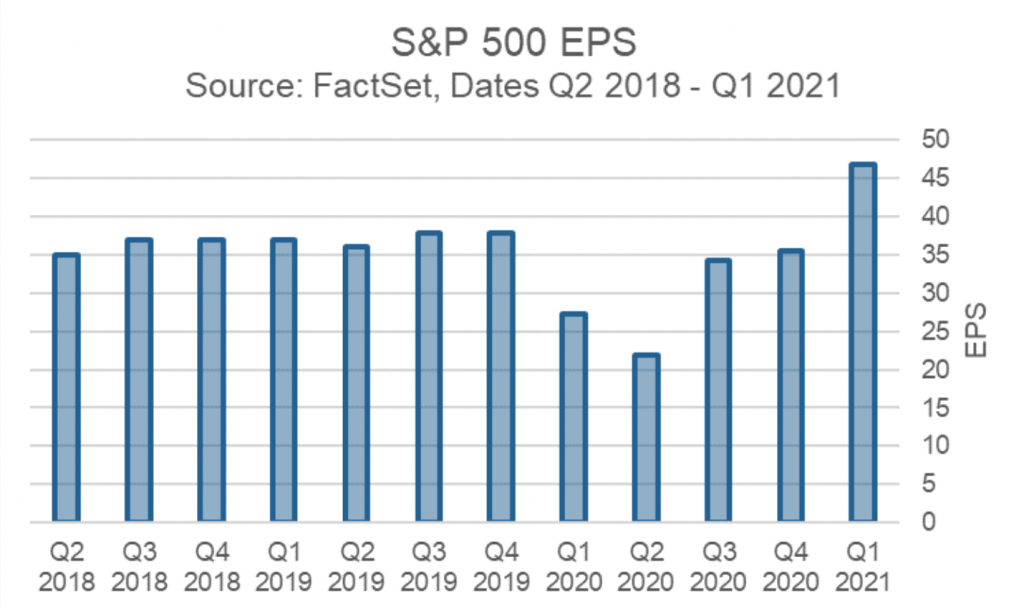
2021 saw the companies that make up the S&P 500 post their highest Earnings Per Shares (EPS) ever (see the chart immediately below). It was 26% higher than the same metric in 2019 for a 12.6% annualized growth rate over 2 years. With this data, we have witnessed a full recovery of earnings power and then some.
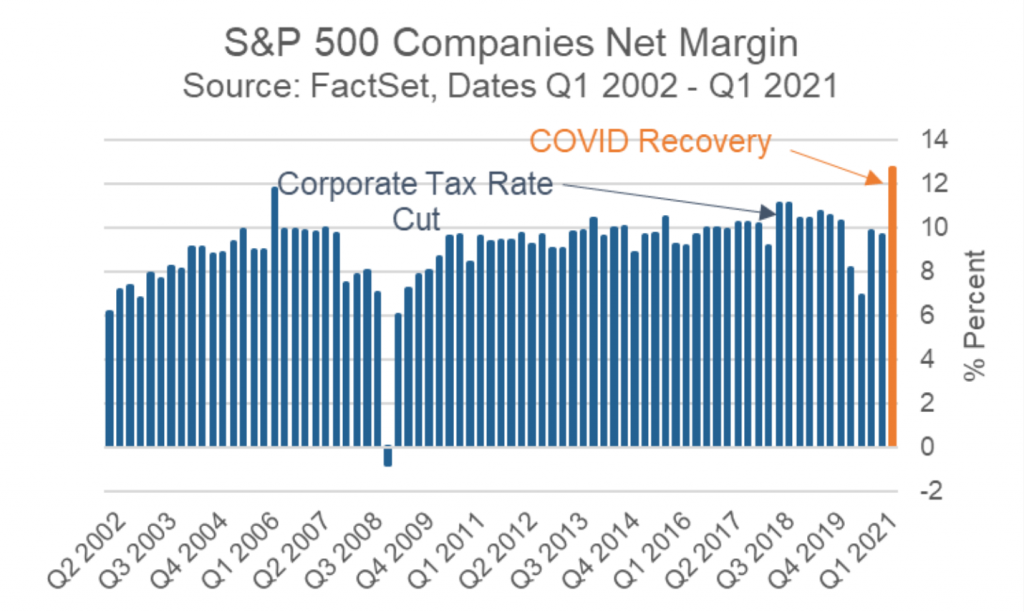
If we step back and look at net margins (the profits generated as a percentage of revenue), we can see that this is the best net margin that the S&P 500 companies have posted in the past 20 years, and it is not even close (see the chart below). The Q1 2021 net margin was 14.5% higher than the most recent high after the 2017 corporate tax cuts which boosted margins significantly.
What are we to make of this? That is the real question. Is the economic recovery complete? I think we can say that it is not, as there are still roughly 7 million less people currently employed in our country versus prior to the pandemic. This tells us that there is quite a bit of slack still in the labor market. We have all heard the reasons behind this massive gulf, but it bears repeating. Many are still collecting inflated unemployment which is due to run out soon if it is not already finished. The federal government’s Job Openings and Turnover Survey (JOLTS) job openings data are at elevated levels as companies are desperately looking to fill positions. The National Federation of Independent Business (NFIB) reported that 48% of small business owners in May indicated that they were having difficulty filling open positions.
If unemployment does get back down to levels that we find attractive, then that will increase the wage bill of companies. When the wage bill increases, the margins go down. Of course, real wages should go up if there is a difficulty in coaxing people to come back to work. And if real wages go up, then consumption can carry on and this economy can continue down a virtuous cycle. This is a long way to say that we are seeing great corporate numbers being put up right now, but don’t be surprised to see the numbers stumble a bit going into the second half of 2021 as economic forces begin to find an equilibrium level.
When we start to see declining margins, that does not mean that everything is over and the economy has hit its secular peak. Most pundits are still guessing as to what all of these economic data numbers mean, and they don’t have a system that can categorize what happens when an economy stops and starts rapidly. We expected some overshooting of inflation targets and margins and other key metrics to the upside, followed by some disappointing numbers. However, just because we may see some disappointing numbers later this year in relation to what we are currently seeing, it does not mean that the recovery is over. We will keep our attention on the long term prospects of the economy and the capital markets and not let ourselves be distracted by the current stat of the day.
Model Updates
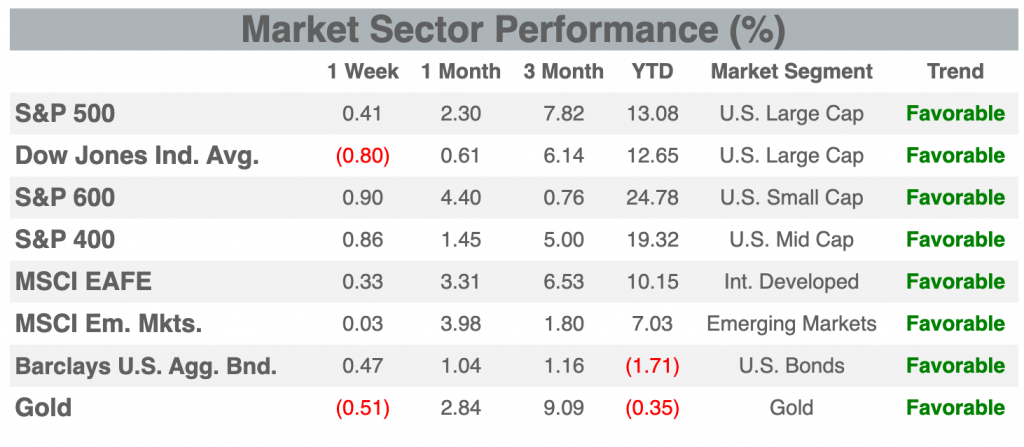
There were no trades in the Fortunatus models during the week ending on June 12th, 2021. The major equity market sectors remain in a long-term favorable trend, and the Fortunatus Asset Allocation models are near their maximum allowable equity exposure with domestic stocks favored over international shares.
On A Lighter Note
Johnny B. of Caseville, MI, writes in : “Hey, On A Lighter Note, I’m having no luck with the ladies. How do I improve my chance for romance?”
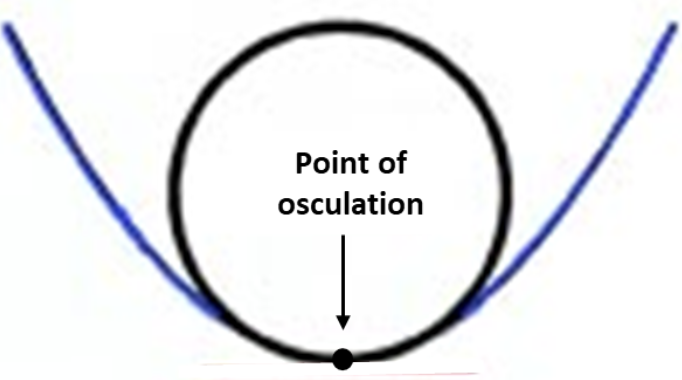
Well, you’ve come to the right place. The first problem young people have today is that they are ignorant of the very basics of the subject, like what is the most romantic curve in all of differential geometry? That should easy, the osculating circle. Never heard of it? Well, first of all, osculating is an old-fashioned way to say “kissing”, ultimately derived from Latin. Mathematically, an osculating circle is the circle that best approximates another curve at a given point by — in very technical terms — snuggling up and giving the other curve a little smooch at the designated point (see below):
During this writer’s heyday, no courtship was complete without the couple exchanging osculating circles, but the swerve of this curve did unnerve teachers, and it was eventually banned from the curriculum after a strict “No Canoodling in Calculus” rule was enacted.
Now, it may just seem to be a forgotten flirtatious figure from yesteryear, but the osculating circle once had the power to drive even history’s greatest minds mad – including the Greek mathematician Archimedes. When a Roman army conquered Archimedes’ home town of Syracuse in 212 BC, a soldier entered his house and demanded that he identify himself. Preoccupied with the drawing on his desk, Archimedes shouted, “Do not disturb my circles!” This enraged the soldier, and he quickly killed the great man. But now you can understand why Archimedes was so concerned about circles, he was composing a love letter to his sweetie.

Archimedes proving that doing math is hazardous to your health.
Executive Wealth Management (EWM) is a Registered Investment Advisor with the Securities and Exchange Commission. Reference to registration does not imply any particular level of qualification or skill. Investment Advisor Representatives of Executive Wealth Management, LLC offer Investment Advice and Financial Planning Services to customers located within the United States. Brokerage products and services offered through Private Client Services Member FINRA/SIPC. Private Client Services and Executive Wealth Management are unaffiliated entities. EWM does not offer tax or legal advice. Please do not transmit orders or instructions regarding your accounts by email. For your protection, EWM does not accept nor act on such instructions. Please speak directly with your representative if you need to give instructions related to your account. If there have been any changes to your personal or financial situation, please contact your Private Wealth Advisor.
Returns are calculated as indicated below with reinvested dividends not considered except for the Barclays U.S. Aggregate Bond Index. Data source for returns is FactSet Research Systems Inc. The London Gold PM Fix Price is used to calculate returns for gold.
1 Week = closing price on June 4, 2021 to closing price on June 11, 2021
1 Month = closing price on May 11, 2021 to closing price on June 11, 2021
3 Month = closing price on March 11, 2021 to closing price on June 11, 2021
YTD = closing price on December 31, 2020 to closing price on June 11, 2021All information and opinions expressed in this document were obtained from sources believed to be reliable and in good faith, but no representation or warranty, express or implied, is made as to its accuracy or completeness. All information and opinions as well as any prices indicated are current only as of the date of this report, and are subject to change without notice. Material provided is for information purposes only and should not be used or construed as an offer to sell, or solicitation of an offer to buy nor recommend any security. Any commentaries, articles of other opinions herein are intended to be general in nature and for current interest. Some of the material may be supplied by companies not affiliated with EWM and is not guaranteed for accuracy, timeliness, completeness or usefulness and EWM is not liable or responsible for any content advertising products or services.