
We have a big week for housing data coming up. We are going to get information on existing home sales, new home sales, and housing inventory. We have seen housing and rents take up an increasing position in the inflation picture this year as commodity inflation has ebbed. Much of the rising housing costs can be put down to the lack of inventory (people selling homes) coupled with very low interest rates that make purchasing a house, or a rental property, relatively inexpensive. The numbers of homes for sale went from averaging around 1.2 million before the pandemic to around 500k in 2021. This is inflationary based solely on the supply and demand equilibrium. Demand fell during and after the pandemic but supply absolutely cratered falling more than -50%. That is the price shock in a nutshell as demonstrated by the chart below.
There are positive data points in the housing market. In July the average price per sq/ft was actually down. Supply is coming back, up 100% from the recent lows. Based on the increase in supply alone, housing inflation may begin to moderate. Illustrated in the chart below with a red arrow is the recent decline in month-over-month price increases. If this trend continues, we can see real estate prices come back to an inflation number that is closer to normal. We were running between 5%-10% price increases for several years in a row before the pandemic. This helped make real estate a great investment since the Global Financial Crisis. However, higher mortgage costs are also putting a damper on housing demand, and when this is coupled with higher supply, we may actually see inflation moderate in the housing market.
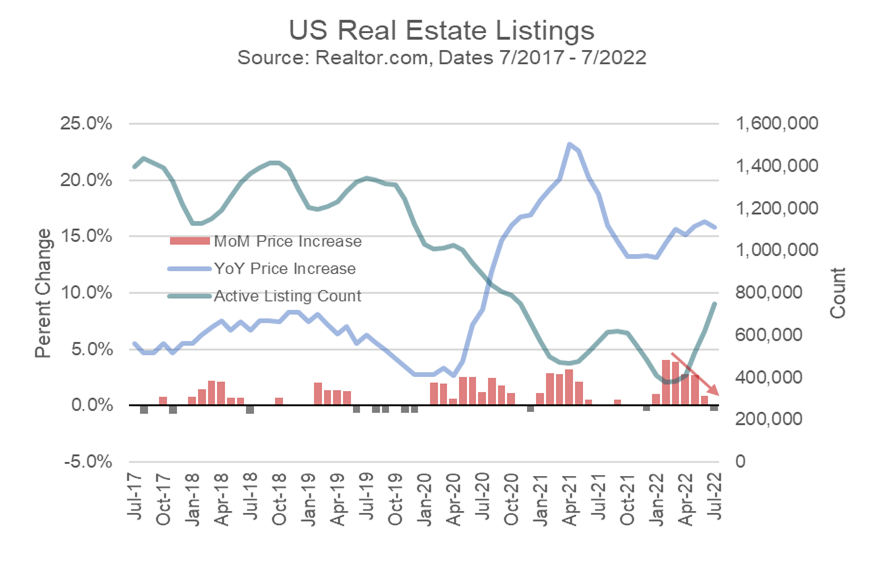
The supply of homes is trending back to normalized levels according to the most recent data, though it is still below pre-pandemic levels. As with other forms of inflation, we desire to see a return to normal price increase levels. We do not want to see a large price decrease in the aggregate price of homes.
Past performance is no guarantee of future results. Trend signals are proprietary research of EWM Investment Solutions, a wholly owned subsidiary of Executive Wealth Management, LLC. Data source for returns is FactSet Research Systems Inc. This chart is not intended to provide investment advice and should not be considered as a recommendation. One cannot invest directly in an index. Executive Wealth Management does not guarantee the accuracy of this data.
Model Updates
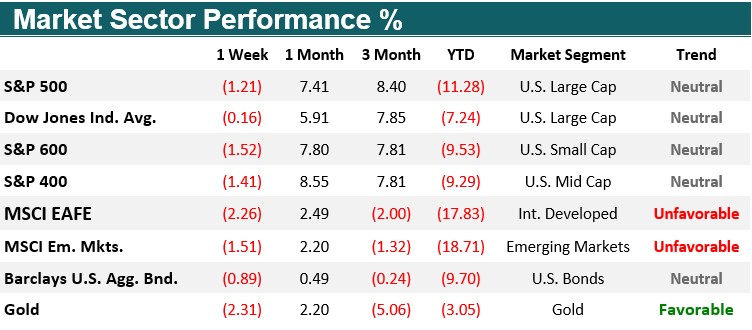
There were no trades in EWM Investment Solutions models during the week ending on August 20th, 2022. All major domestic equity market sectors are currently in a neutral trend, while international equity remains in a long-term unfavorable position.
Quote of the Week
“But the retail sector is abuzz about consumers trading down. After Walmart beat earnings estimates this past week, it said that customers were buying less deli meat and more chicken, hot dogs, and canned tuna, and that U.S. stores were getting a lift from high-income shoppers stopping in for bargains.”
_______________________________________________________
An excerpt from Jack Hough’s recent article in Barron’s titled “Anyone Else Turning Cheap? It Looks Like a Trade-Down Economy” detailing the growing frugality of American consumers.
Out & About


August 15, 2022, the EWM Team went to a Habitat For Humanity job site in Howell. We spent all day putting siding on the house, building a roof on the shed, and painting the inside of the home. We look forward to serving our community as a team!
Thank you for your patience and understanding in allowing us to spend a day volunteering with Habitat for Humanity.
EWM In the News

Join the EWM team in supporting this year’s Livingston County Walk to End Alzheimer’s! Anyone is welcome to join us in the walk on September 24, 2022, or you can simply donate to the organization.
Learn how to become more involved by clicking the link below!
A Live With Confidence Minute: Community
Bert Herzog
EWM Founder, Director, Private Wealth Advisor

Why Should I Have My 401k Managed?
The Debut of Roller Skates was a Smash!


In the 1760s, John Joseph Merlin was a distinguished Belgium clock maker, musical instrument maker, and successful inventor. Merlin created the first inline roller skates, which strapped directly onto shoes. Before learning to use them well or provide a way of stopping once rolling on them, he decided to debut them at an elegant costume ball for the guests.
Merlin added a masquerade mask to his gentleman’s attire of the day and proceeded to skate around the ball while playing violin. The music he played was classical, but his antics at trying to keep from falling could have been labeled ‘rock and roll.’ The public debut of his new invention found him with severe injuries, a crushed violin, and a large mirror left in glass shards, valued to be worth 100k in today’s currency. It was one of the rare, if only times, an invention was considered both a failure and a smash.
Executive Wealth Management (EWM) is a Registered Investment Advisor with the Securities and Exchange Commission. Reference to registration does not imply any particular level of qualification or skill. Investment Advisor Representatives of Executive Wealth Management, LLC offer Investment Advice and Financial Planning Services to customers located within the United States. Brokerage products and services offered through Private Client Services Member FINRA/SIPC. Private Client Services and Executive Wealth Management are unaffiliated entities. EWM does not offer tax or legal advice. Please do not transmit orders or instructions regarding your accounts by email. For your protection, EWM does not accept nor act on such instructions. Please speak directly with your representative if you need to give instructions related to your account. If there have been any changes to your personal or financial situation, please contact your Private Wealth Advisor.
Returns are calculated as indicated below with reinvested dividends not considered except for the Barclays U.S. Aggregate Bond Index. Data source for returns is FactSet Research Systems Inc. The London Gold PM Fix Price is used to calculate returns for gold.
1 Week = closing price on August 12, 2022 to closing price on August 19, 2022
1 Month = closing price on July 19, 2022 to closing price on August 19, 2022
3 Month = closing price on May 19, 2022 to closing price on August 19, 2022
YTD = closing price on December 31, 2021 to closing price on August 19, 2022
All information and opinions expressed in this document were obtained from sources believed to be reliable and in good faith, but no representation or warranty, express or implied, is made as to its accuracy or completeness. All information and opinions as well as any prices indicated are current only as of the date of this report, and are subject to change without notice. Material provided is for information purposes only and should not be used or construed as an offer to sell, or solicitation of an offer to buy nor recommend any security. Any commentaries, articles of other opinions herein are intended to be general in nature and for current interest. Some of the material may be supplied by companies not affiliated with EWM and is not guaranteed for accuracy, timeliness, completeness or usefulness and EWM is not liable or responsible for any content advertising products or services.
Copyright © 2022 Executive Wealth Management. All rights reserved.