
Domestic stocks rallied last week with the S&P 500 gaining more than 2.5% on a total return basis. It was a welcomed respite from the previous three losing weeks of equity returns. It was even more delightful for the gains to occur in the first week of September, a month that has traditionally been very tough on equities.
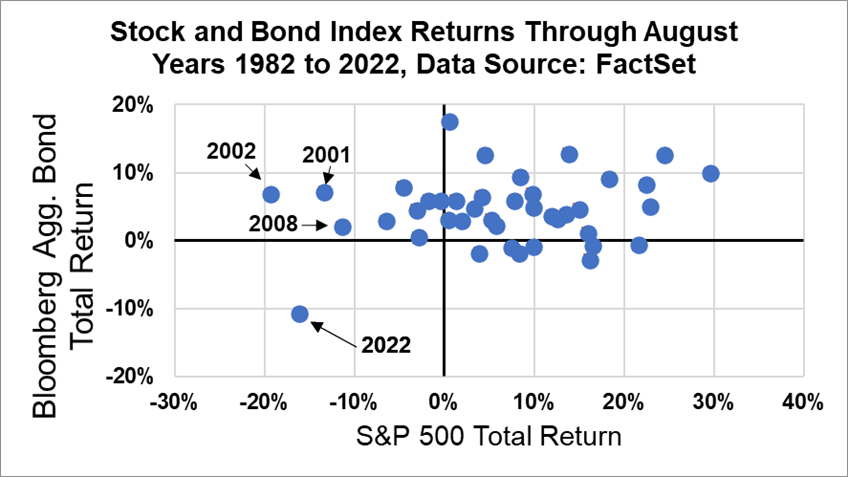
However, as the chart below shows, 2022 has definitely been a year where the financial markets don’t follow previous patterns. The vertical axis of the graph measures the total return of the Bloomberg Aggregate Bond Index, the most widely followed fixed income index, during the first eight months of the year. The horizontal axis measures the total return of the S&P 500 until the end of August each year. Every year since 1982 is represented as a blue dot on the chart, with 2022 making a most conspicuous break from the pack to reside, by itself, in the negative lower left-hand quadrant. As you can see from the other labeled dots, even years that were notorious for their stock downturns – like the dotcom bubble bursting of 2001 to 2002 or the Global Financial Crisis of 2008 – still had some positive support from fixed income. 2022 is unique in that bonds have provided no buffer for diversified investors as their equity positions suffered. So maybe it might be possible during such an unorthodox year to have the stock market bounce back in it what historically has been its weakest month.
While concerns about a looming recession and the outlook for corporate earnings will certainly move the market, the ever-evolving expectations for interest rates and inflation still remain the main driver of returns. And this week will feature two key data reports on inflation that may determine if investors have a satisfactory September.
On Tuesday, the Bureau of Labor Statistics releases the consumer price index (CPI) for the month of August. This closely watched gauge of inflation is forecasted by economists to show price increases of 8.1% year-over-year, a slower pace than the 8.5% reading in July and the 9.1% jump in June. The recent decline in gas prices should be the main impetus for the deceleration; while core CPI, which excludes the volatile food and oil sectors, is expected to pick up to 6.1% year-over-year in August compared to its previous 5.9% reading. In testimony before Congress in 2019, Federal Reserve Chairman Jerome Powell stated that inflation expectations were an important driver of actual inflation, and the next important measure of those expectations will come this Friday when the University of Michigan releases its Consumer Sentiment Index for September. Both one- and five-year inflation expectations have fallen from recent peaks in U of M’s data series.
Click the link below to sign up for the full EWM Weekly Newsletter.
It’s packed with additional resources to help you Live with Confidence!
Executive Wealth Management (EWM) is a Registered Investment Advisor with the Securities and Exchange Commission. Reference to registration does not imply any particular level of qualification or skill. Investment Advisor Representatives of Executive Wealth Management, LLC offer Investment Advice and Financial Planning Services to customers located within the United States. Brokerage products and services offered through Private Client Services Member FINRA/SIPC. Private Client Services and Executive Wealth Management are unaffiliated entities. EWM does not offer tax or legal advice. Please do not transmit orders or instructions regarding your accounts by email. For your protection, EWM does not accept nor act on such instructions. Please speak directly with your representative if you need to give instructions related to your account. If there have been any changes to your personal or financial situation, please contact your Private Wealth Advisor.
Returns are calculated as indicated below with reinvested dividends not considered except for the Barclays U.S. Aggregate Bond Index. Data source for returns is FactSet Research Systems Inc. The London Gold PM Fix Price is used to calculate returns for gold.
1 Week = closing price on September 2, 2022 to closing price on September 9, 2022
1 Month = closing price on August 2, 2022 to closing price on September 9, 2022
3 Month = closing price on June 2, 2022 to closing price on September 9, 2022
YTD = closing price on December 31, 2021 to closing price on September 9, 2022
All information and opinions expressed in this document were obtained from sources believed to be reliable and in good faith, but no representation or warranty, express or implied, is made as to its accuracy or completeness. All information and opinions as well as any prices indicated are current only as of the date of this report, and are subject to change without notice. Material provided is for information purposes only and should not be used or construed as an offer to sell, or solicitation of an offer to buy nor recommend any security. Any commentaries, articles of other opinions herein are intended to be general in nature and for current interest. Some of the material may be supplied by companies not affiliated with EWM and is not guaranteed for accuracy, timeliness, completeness or usefulness and EWM is not liable or responsible for any content advertising products or services.
Copyright © 2022 Executive Wealth Management. All rights reserved.